System evolution and creep
1. Basics on creep
Let us recall some basics (Garofalo,1965) on creep. Creep is the progressive deformation of a material under constant load at a given temperature. Above a minimum temperature called the "critical temperature", maintaining the load will cause the material to rupture after a time that will depend on the temperature, the load level and other environmental constraints (corrosion, etc.). It is a continuous phenomenon, each period of time being a function of the preceding period.
For a metal, the macroscopic result of creep at high temperature is represented by the creep curve, i.e. the curve giving the cumulative strain over the operating time . Notwithstanding the underlying microscopic events, this curve shows always the same three successive stages : a first stage, called "primary (or transient) creep," where the curve has a concave shape, followed by a second stage, called "secondary (or stationary, or steady) creep," corresponding to a nearly straight line, and, finally, the "tertiary creep" stage, where the curve is convex, reflecting an acceleration of the strain up to rupture. It is obvious that, when we take the derivative of the creep curve with respect to time, we shall obtain a "bathtub" shaped curve. When the test is performed at a temperature under the critical temperature, only the first stage will be present.
Primary creep is usually interpreted as an adaptation stage, secondary creep as the useful life period, while tertiary creep corresponds to decreased resistance due to advanced age .
2. Creep of metals
The creep of metals is probably the simplest phenomenon reflecting system evolution kinetics. This is due to the fact that the constraints S and T on a creeping sample can be carefully tuned in laboratory and maintained constant during the whole duration of a creep test while other environmental influences can be either removed as undesirable or, on the contrary, designed as complementary well measured constraints. In addition, the crystalline nature of metals and the metallic binding make them very cohesive and well reproducible systems. Defining the test temperature and stress (i.e., the average internal stress in the metal) is at the base of any creep test. The ageing kinetics is then measured by carefully recording the strain. Therefore, many tests have been performed during the last century resulting in a huge set of available data on a great amount of metals. Tables and bi-logarithmic diagrams giving the 1% strain or the rupture time versus the applied stress at a given temperature can be found in the literature and in standards. Indeed a power relationship exists between the parameter "K" of Equation E-1 and the stress "S". This can be expressed as:

This makes it possible to rewrite Equation E-1 as follows (given the existence of a critical time "ti" and placing oneself at this time):

where: "ln" stands for "natural logarithm" and

with Ei=E(ti).
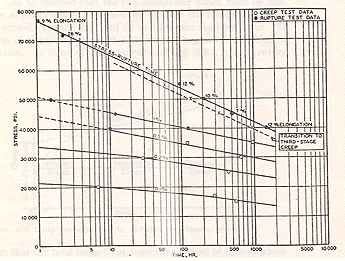
This equation can be visualised in bi-logarithmic plots "lnS vs ln(ti)" which are equivalent to those "lnS vs ln(tr)" found in literature and standards (see figure hereafter).
To our knowledge, no other model allows to do that : start from the equation of a particular creep curve to find bi-logarithmic plots equivalent to those found in the standards for the rupture time (vs stress).
Besides, an equation very similar to the above was found by Booker and co-workers (1977) after extensive computer fitting of data for the rupture time of a low-alloy Cr-Mo steel.

Indeed, the rupture time "tr" is what experimenters record. However, using the critical time rather than the rupture time will usually reduce the scatter.
Full creep curves have less been published than rupture times but are anyway abundant. All this material is systematically used by engineers to tackle design and operating problems of components working at creep temperatures. The creep of metals can probably be considered as the basic reference mutatis mutandi to assess the ageing and evolution of systems when data are partly missing.
Several well-known equations for the creep of metals can be found back using the system evolution
kinetics approach (see Crevecoeur,
1992) : the classical equations of Andrade,
Norton and Monkman-Grant.
3. Creeping metal as a
system
When we now want to describe what is occurring, at the microscopic level, in a metal subject to high temperature uniaxial creep, we observe schematically the following: several grains corresponding to various crystal orientations slide on each other along their boundaries in the direction of the imposed load. This is because the external load induces stresses in the interatomic bonds, and these bonds fail preferentially at the grain boundaries, being the weak zones at high temperature.
More precisely, there is a combination of complex mechanisms that can be summarized as follows : a large amount of lattice dislocations preexist in the structure, but new dislocations are continuously created during the creep process due to the imposed load. The load makes most dislocations in grains and grain boudaries move, resulting in a lot of interactions with other components of the microstructure, such as neighboring dislocations, alloy atoms in solution, precipitates, dispersed phases, impurities, sub-grains, etc. Owing to the resulting entanglement, the metal hardens. However, under high temperature conditions the creation of dislocations is thwarted by their annihilation by a thermally activated restorative process. The result of the dis-location annihilation is the creation of lattice vacancies that are attracted to grain boundaries via diffusion to form microvoids. These grow in number and size. A simplified image of what occurs during steady creep is given by a balance between the creation and the annihilation of dislocations. Vacancies and microvoids weaken the grain boundaries, allowing the grains to slide on each other in the load direction. Additional microvoids then also form at boundary triple points as a result of grain boundary sliding.
The metal preserves its integrity all the time at the expense of an increment of deformation originating in the various grain boundary slidings, since new microscopic metallic bonds are formed instantly .
However, this process remains valid only up to a time at which a critical deformation (or amount of microvoids, or density of vacancies, etc.) is reached. At that time, necking occurs: one region yields which accelerates the process up to rupture corresponding to the highest possible deformation level (called "ductility").
To end this description of creep, let us point out that creep also occurs in non-metallic materials, but the corresponding microscopic mechanisms can be very different from one material to the other.
From the preceding description, we see that a creeping metal can be considered as a collection of microscopically interlinked parts (grains, precipitates, lattice dislocations, etc.) that interact to enable the metal to operate, ie. to withstand an imposed external load.
In that sense, a creeping piece of metal can be described as a "self-repairable" system whose integrity during operation is maintained by internal adaptations.
We conclude that a creeping piece of metal and an operating system can both be characterized as follows : they both must perform a given task under given conditions, as a result of which their subparts interact. These interactions induce responses which are sometimes non-standard. The non-standard responses may lead, at term, to decohesion. After a transient stage corresponding to "youth illnesses," a steady regime prevails . This is considered the useful life. At end of life the failure rate increases steeply, reflecting general wear.
4. Creep in other
materials
The approach can also be used to assess creep data or creep related measurements in other materials than metals. For instance, compressive creep on cellular glass can be followed using acoustic emission
(Strauven,1996). For high loads, the acoustic emission energy rate for a typical experiment follows a full "bathtub curve". For lower loads, only the first "learning" part is observed, the threshold corresponding to a kind of "fatigue limit".
5. Creep at very high
temperature
When constant load creep tests or constant strain rate tensile tests are performed under vacuum on carbon-steel at very high temperatures (1100 - 1400 °C), the three-stage kinetics is found back (Crevecoeur,1975).
6. Connexion with reliability
growth
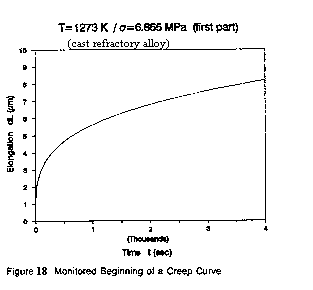
The interpretation of primary creep is equivalent to reliability growth. This is easily shown using the first part (see Fig. 18 hereafter) of a creep curve, for instance of the one already quoted:

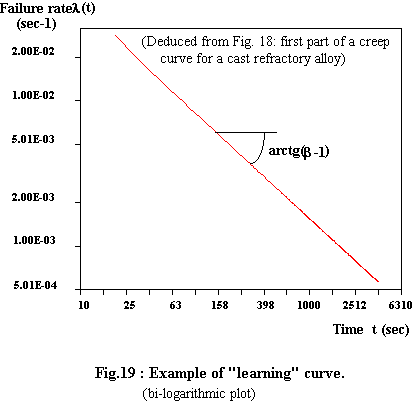
When we plot the corresponding strain rate evolution in a bi-logarithmic diagram, we obtain a straight line as shown on figure 19:

This in full agreement with Duane's equation for the failure rate (the "learning" curve ). As for tertiary creep, it can be connected to wear-out phenomena.
Back to Home page

Page last revised: September 7th,
2015
Best viewed with Explorer
© All rights reserved
- Sysev (Belgium) 15/03/98


